Infographic and Reflection
When I was first required to do an infographic I was unsure what it included. Unaware of the product or process, I dove into the creation of an infographic head on. Based on other student recommendations, I decided to use piktochart as my platform to create my infographic.
First, I needed to develop a plan to support my infographic idea, “can the flipped classroom increase student engagement?” While finding information I felt the process itself was meaningful. Being a physical education teacher, I am extremely hands on when it comes to learning. Therefore, I was very excited to showcase how the flipped classroom can provide more opportunities for teachers to interact with the content on a deeper level.
Why is a Flipped Classroom important and relevant to me?
I started to think about topics relevant to myself and my classroom setting and came to the conclusion of an idea around a flipped classrooms. Not only is it important to me but it is also relevant in my career. This school year, our district has been trying to incorporate the flipped classroom more into our everyday routine. Unlike many teachers, I saw potential when it came to the flipped lesson but was unsure on how much potential there was. This project allowed me to research and organize my thoughts. It also allowed me to develop a visual on why the flipped classroom is beneficially for so many teachers. A speaker came to Maloney and discussed Marzanno! Right away I knew who he was and was excited to be learning about him both at my workplace and in this #idtml program. The gentleman speaking referenced Marzanno and said, the US schools are spending 58% of class time Interacting with new content, 36% practicing the information and only 6% with cognitively complex tasks such as generating and testing hypotheses. So I thought, why are we sending students home with the hard work without anyone at home able to assist them if needed. Why not flip Bloom’s Taxonomy and do the “hard stuff” at school.

Some hards I found in creating a flipped classroom are if students don't have access to the internet. If students do not have access to the internet how can they watch the created videos? Luckily students can be provided with a flash drive with the videos already transported onto them. All the student has to do is connect the flash drive to a computer and they would have access to numerous videos. The students can also use an ipod or MP4 player and listen to an audio version of the lesson. The last resort is to burn the lessons on a DVD for the student to watch.
Make recommendations for other’s who want to create an infographic (offer suggestions for how to use them in the classroom and suggest resources for assessing them)
Some suggestions I would give to other professionals or students willing to create an infographic is “play with it”. The process isn't as scarey as it may seem and it is a great way to visually represent information. For example, in my physical education classroom, I will be using an infographic to visually display the basic rules and skills of each unit. In my health classroom I am already planning on having the students create an infographic based on a topic assigned to them. They would research the information and create a visual display to showcase to the class.
Explain how your work improved through this collaborative design process
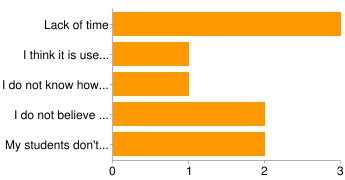
I believe no task is possible without collaboration from my peers. It is always better to have more eyes analyzing a topic closely because each person can add a beneficially piece to the pie. I shared my infographic with not only my peers in the #itdml program but also with other coworkers. Each group provided feedback to enhance and create my final infographic. One of the most beneficially pieces of feedback I received was used not only for this class but for my school. As I previously stated, my school is pushing the flipped classroom. One of my survey questions asked, what is the reason for not doing a flipped lesson? Below is a chart showcasing the responses of my #itdml peers as well as some of my coworkers at school. this information was beneficial for my administration to see because now they can try and allow teachers more time to create a lesson and stress the importance of it to the staff.
I do believe piktochart made the process of created my very first infographic relatively easy. So after collaboration with my peers, numerous hours of research, and surveys. Overall, I am extremely happy I did an infographic on the flipped classroom. I changed some of my statistics as well as added videos of what a flipped classroom looks like at all the different levels of learning. Here is my completed infographic.
No comments:
Post a Comment